Navigating the Chicago real estate market isn’t always easy. While there’s plenty of information covering the overall market, it can be difficult to find statistics for your specific neighborhood. So, to help end your frustration, we’ve broken down Chicago’s March market update to give you a better idea of what’s happening in real estate right now.
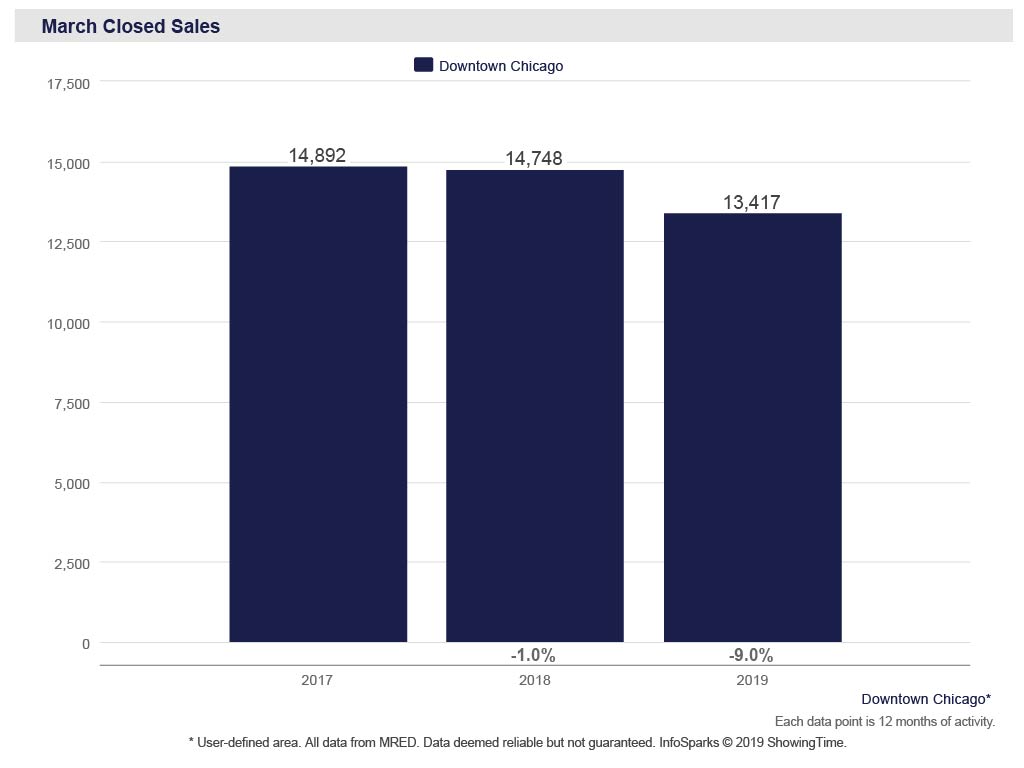
Over the past few months, the market (in general) has seen a slow down. Don’t be afraid, this does not mean prices have or will drop. This means there were fewer sales than average, even below average this time, last year.
What does this mean for buyers?
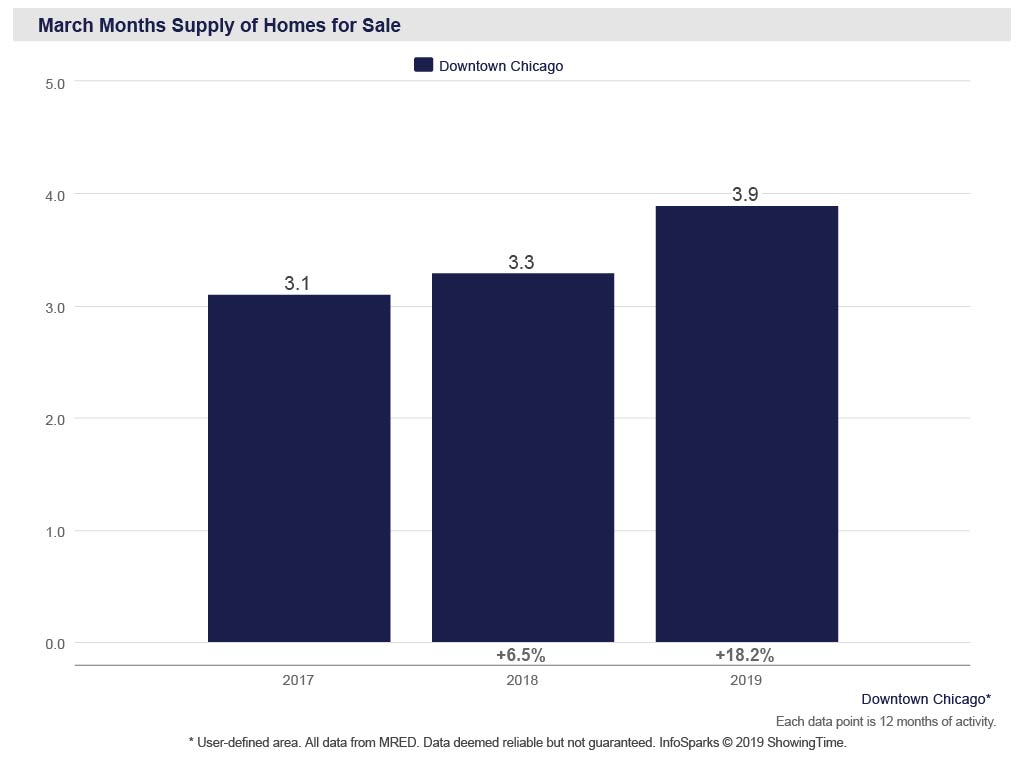
This is good news! The Chicago real estate market shows a high rate of home sales, reflected in the graph below, which means there is more inventory on the market- meaning buyers have plenty of homes to choose from. Even more good news, mortgage interest rates are falling, helping your home buying power. In addition to the high supply of homes, the Chicago real estate market time for a house has increased which gives buyers more time to find their ideal home. This isn’t to say great listings won’t sell quickly with little competition, it just means there is less of a rush than previous years.

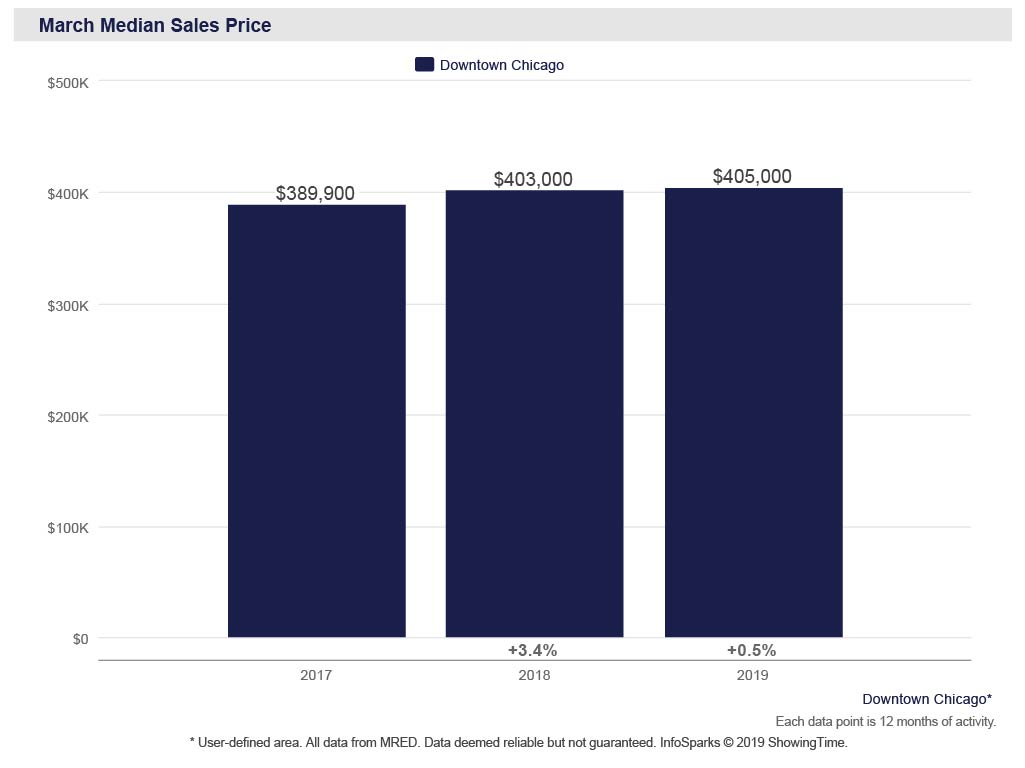
If you’re wondering how much it would cost to buy a home in Chicago, the Median Sales Price graph is a good place to start. Keep in mind that this is a just the media price for select Chicago neighborhoods. Some neighborhoods, like Old Town or River North, will cost much more than the below number. While others, like Ravenswood or Humboldt Park, are often more affordable.

What does this mean for sellers?
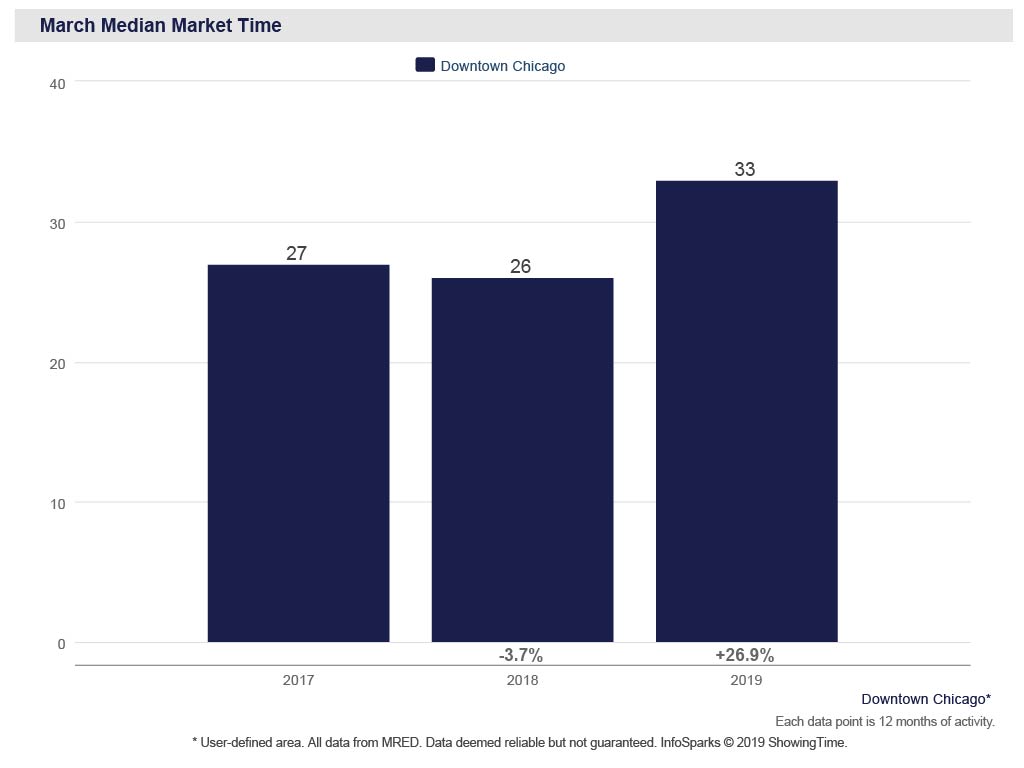
The graph below tells us how long it’s taking most city homes to go under contract after they’re on the Chicago real estate market. This month, we’re seeing fewer transactions so you will most likely see your house taking longer to sell. As stated earlier, with the Supply of Homes increase buyers feel less pressure to purchase a house quickly. Instead, they’re looking at multiple homes before settling on one, which can contribute to the amount of time your home is on the market.

While it is still considered to be a sellers market, fewer homes were sold last month compared to previous years. In addition, home prices have been steadily dropping over the past 4 months. However, this could be a residual effect from the very slow Q4 2018. Towards the end of 2018 a large number of homes sat on the market for a while until they finally went under contract at the beginning of 2019 and then officially sold in March. The price decline will mostly likely taper off once the next couple reports come out.

No matter how the market looks, always remember that every home and homebuyer is different. So feel free to call us for a free analysis of your home or buying criteria so we can help get you started on your path to a new home!
*Map outline of the Downtown Chicago area used in the above stats
Check out our featured neighborhoods to learn more about the Chicago real estate market in your area.


Leave a Reply
You must be logged in to post a comment.